Analysis
What Indiana loses without Haliburton: the analysis behind 1–6
Indiana's 1–6 record without Haliburton exposes a problem that goes beyond the point guard position. What the Pacers lose in creating advantages, how Nembhard and Siakam can help, and how that connects with the numbers from their first eleven games.
Indiana has a problem that cannot be solved simply by changing who brings the ball up the floor. After eleven games, the Pacers are 3–8: they won two of the four games Tyrese Haliburton played and just one of the seven he missed, between October 28 and November 9. The contrast is striking. Understanding it, however, requires considering what an offense needs when its primary organizer is unavailable.
A point guard can influence a possession well before recording an assist. The timing of a pass matters, as do the receiver's location and the defenders' positions when the next action begins. That offers a more useful way to think about Haliburton's absence: how much work everyone else must now do to create an advantage, and how much time remains to use it.
There is a historical reference that helps frame that discussion. In 2025, John Schuhmann highlighted Indiana's transition game for NBA.com. That refers to that team's identity, not a measurement of its current performance. For the start of 2026-27, the box scores describe the decline; a tactical explanation requires separating what has been counted from what we offer as basketball interpretation.
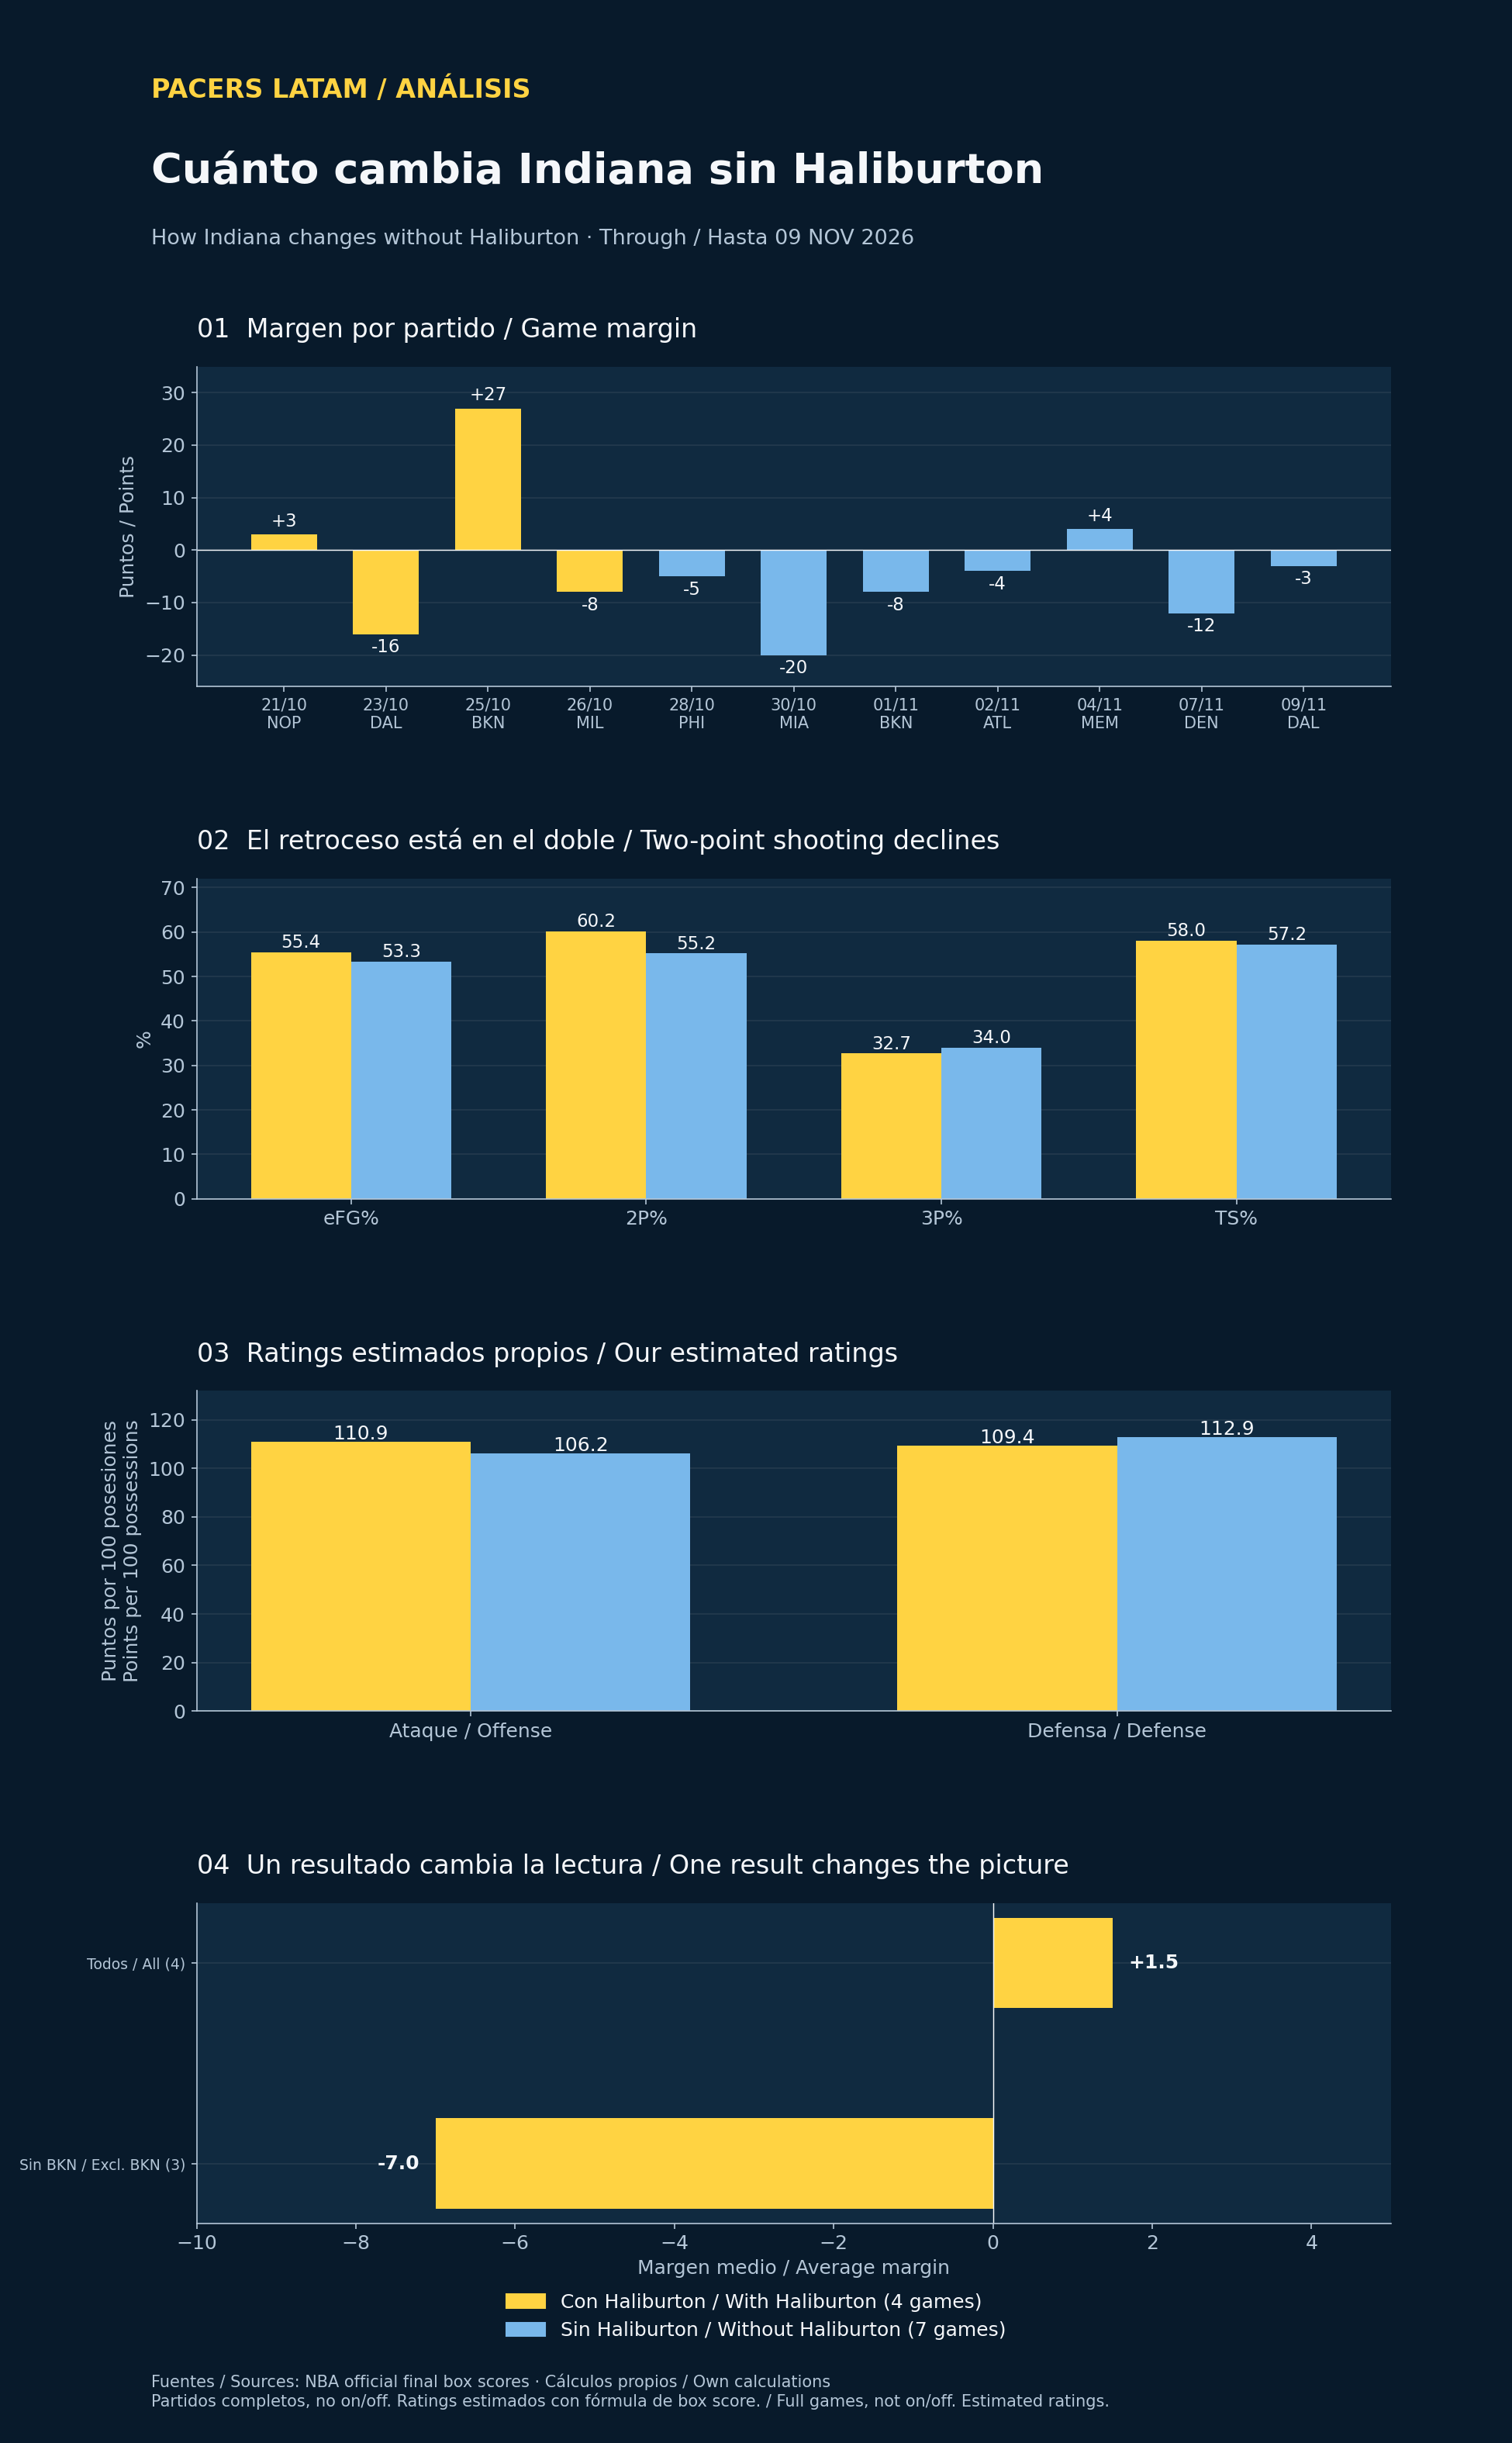
The numbers show where to begin. With Haliburton available, Indiana scored 116.5 points per game; without him, 108.4. Points allowed barely changed: 115.0 compared with 115.3. At first glance, the difference appears concentrated on offense. But estimated possessions also fall, from 105.1 to 102.1 per game. The team has fewer scoring opportunities and uses them less efficiently.
Our calculations from the box scores put the offense at 110.9 points per hundred estimated possessions with the point guard and 106.2 without him. The defense goes from allowing 109.4 to 112.9. These are our estimates, not the official NBA Stats ratings. The distinction matters: allowing almost the same points in a game with fewer possessions does not mean defending equally well.
On the court, playing fast is about more than running. A pass up the floor or an action initiated before opponents establish their matchups can also accelerate a possession. The benefit is forcing defenders to make decisions while retreating. When that does not happen, the offense must create against five positioned defenders, with help ready and less space available.
That presents one of Indiana's toughest assignments: finding half-court creation without asking Nembhard to become a copy of Haliburton. The pick and roll —a screen for the ball handler followed by the screener's movement toward the basket— provides a starting point. Its value extends beyond a shot by the guard or a pass to the big man. It can also shift the rim protector and force help from the side.
Against a big man waiting near the paint, the ball handler needs to threaten with a shot or penetrate far enough to force a decision. If two defenders commit to the ball, an early release to the screener may offer the opening. If the defense switches, recognizing the mismatch before spending several seconds dribbling can help. These are potential responses to different coverages, not actions we have counted across these seven games.
For Nembhard, the proposal would be to manage those decisions clearly and connect the first action to the next. If a screen creates no advantage, playing again through the big man, reversing the ball or finding Siakam may be more productive than restarting late in the clock. A pass helps when it improves the receiver's situation; circulation alone does not force a defense out of shape.
Siakam offers another route. Indiana can look for him near the post, at the elbow or catching on the move. From there, the question is how the defense responds: whether it allows him to play one-on-one or sends help that frees a teammate. Our proposal is to give him opportunities to make that initial decision and distribute creation, rather than placing every possession's opening burden on the point guard.
That also demands something from teammates without the ball. A cut can punish a defender watching the ball too closely; a well-positioned shooter can make help more expensive. Moving everyone toward the player trying to create, by contrast, shrinks the available space. These offensive principles offer a framework for evaluating Indiana, without assigning them a frequency or effectiveness that these score sheets do not record.
The most revealing shooting figure comes inside the three-point line. Indiana goes from making 60.2% of its two-pointers to 55.2%. Three-point accuracy, meanwhile, rises from 32.7% to 34.0%, and outside shots increase their share of field-goal attempts from 42.6% to 44.4%. Explaining everything through poor three-point shooting would miss the largest decline.
Effective field-goal percentage, which accounts for the extra value of threes, drops from 55.4% to 53.3%. That invites examination of how Indiana reaches its two-point attempts: receiving with an advantage and finishing is a different task from creating separation against a set defense. But asserting that Indiana is taking fewer open shots or getting blocked more often would go too far. Those conclusions require video or tracking data we do not have here.
Free throws provide some compensation. Makes per field-goal attempt rise from 0.189 to 0.220, which helps explain the smaller decline in true shooting, a measure that incorporates free throws: from 58.0% to 57.2%. Even so, production falls short. Field-goal attempts drop from 89.8 to 84.3 per night, while offensive rebounding rate, calculated from available individual rebounds, falls from 21.6% to 18.5%.
Offensive rebounding belongs in the discussion because it gives another chance to an offense that has already worked to produce an attempt. It also presents a collective decision: how many players pursue the rebound and how many protect the retreat. Demanding that everyone crash the glass without considering the defensive cost would be unreasonable. Evaluating how to recover some second chances without becoming exposed at the other end makes sense.
Assists also require context. They fall from 29.3 to 26.9 per game, but the proportion of assisted baskets rises from 67.2% to 69.6%. There is no contradiction: Indiana makes fewer field goals, and a larger share of those makes follows a pass. That percentage alone does not establish whether the team created good attempts or how many advantages disappeared before the finish.
Something similar happens with turnovers. They go from 15.5 to 14.7 per game, although their rate over field-goal attempts, weighted free throws and turnovers remains virtually unchanged at 13.4%. Playing fewer possessions can reduce total mistakes without improving ball security. The objective should be producing more from each attack, not simply surrendering fewer balls in one night.
So far, the interpretation supports the idea of a team struggling to create and sustain advantages. It does not support assigning everything to the missing player. Against Atlanta, only six players were available; Nembhard, Siakam and Nesmith were also out. McConnell did not make his season debut until the Denver game. Replacing the main organizer with an incomplete rotation is a different problem from doing so with every alternative available.
Four games are also far too few to establish the team's level with Haliburton. The 27-point win over Brooklyn carries considerable weight: removing it solely to examine that influence leaves the other three games with a −7.0 margin, rather than the full group's +1.5. There is variation on the other side too: excluding the 20-point defeat at Miami leaves the other six games without the point guard at −4.7. The charts retain every game in the main comparison.
Repeated opponents reinforce that caution. With Haliburton, Indiana lost to Dallas by sixteen; without him, by three. Against Brooklyn, it went from winning by twenty-seven to losing by eight. Venues, available teammates and opposing players on the floor changed. Neither 2–2 proves that everything was working nor 1–6 explains every defeat through one absence.
His minutes provide another signal, with clear limits. Haliburton accumulated +19 in 132 minutes and seven seconds; across the remaining portion of Indiana's 528 team minutes, the Pacers were −61. Scaled to 48 minutes, that is approximately +6.9 with him on the floor and −7.4 without him. This includes both his bench minutes and the games he missed: it is not a possession-based net rating and does not separate his contribution from his teammates'.
To recover from this start, Indiana needs a shared response. Nembhard can organize, Siakam can serve as a creation point, and the second unit needs a recognizable way to initiate offense. The tactical demand is for one action to prepare the next: a screen that moves a help defender, a catch that allows an immediate attack, a release pass that finds someone ready to decide.
That should be the standard for evaluating the adjustment. Improving two-point shooting, recovering offensive rebounds and raising efficiency per possession would be concrete signals. Video would also be needed to establish whether those improvements come from more coordinated decisions and better advantages rather than simply a good shooting night.
The 1–6 record is the outcome of these seven games, not a verdict on the roster. Haliburton's absence makes a basketball question more urgent: who creates the initial advantage, and how do the other four use it? Indiana must find its own answers while its point guard is unavailable, without expecting another player to solve possessions in exactly the same way.
Sources
- NBA — Official Scorer's Report, 2026-10-21 INDNOP (FINAL BOX)
- NBA — Official Scorer's Report, 2026-10-23 DALIND (FINAL BOX)
- NBA — Official Scorer's Report, 2026-10-25 INDBKN (FINAL BOX)
- NBA — Official Scorer's Report, 2026-10-26 INDMIL (FINAL BOX)
- NBA — Official Scorer's Report, 2026-10-28 PHIIND (FINAL BOX)
- NBA — Official Scorer's Report, 2026-10-30 INDMIA (FINAL BOX)
- NBA — Official Scorer's Report, 2026-11-01 BKNIND (FINAL BOX)
- NBA — Official Scorer's Report, 2026-11-02 ATLIND (FINAL BOX)
- NBA — Official Scorer's Report, 2026-11-04 INDMEM (FINAL BOX)
- NBA — Official Scorer's Report, 2026-11-07 DENIND (FINAL BOX)
- NBA — Official Scorer's Report, 2026-11-09 INDDAL (FINAL BOX)
- Indiana Pacers — Game Rewind, Hawks, November 2
- NBA / RotoWire — T.J. McConnell, season debut
- NBA Stats — Statistical glossary
- John Schuhmann — NBA.com, Finals Film Study (2025), contexto histórico / historical context